
Figure S1. (EPS)
Comparison of different metrics of prediction power. Model predicted binding intensities are correlated to ChIP-seq reported binding intensities (y axis). The model predictions were based on sequence data alone (Control-1), sequence data plus randomized epigenomic data (Control-2), or sequence data plus one epigenomic mark (other columns). Results on training data (shaded bars) and testing data (hollow bars) using Spearman correlation (red bars) and Pearson correlation (blue bars) are plotted. The model inferred influence of each epigenomic mark to Nanog binding ( in Equation (5)) is given in the brackets following each mark.
doi:10.1371/journal.pcbi.1003367.s001

Figure S2. (EPS)
Comparison of window sizes on model predictions. Model predicted binding intensities are correlated to ChIP-seq reported binding intensities (y axis). The model predictions were based on sequence data alone (Control-1), sequence data plus randomized epigenomic data (Control-2), or sequence data plus one epigenomic mark (other columns). Results on training data (shaded bars) and testing data (hollow bars) with the window sizes of 350 bp (red bars) and 500 bp (blue bars) are plotted. The model inferred influence of each epigenomic mark to Nanog binding ( in Equation (5)) is given in the brackets following each mark.
doi:10.1371/journal.pcbi.1003367.s002
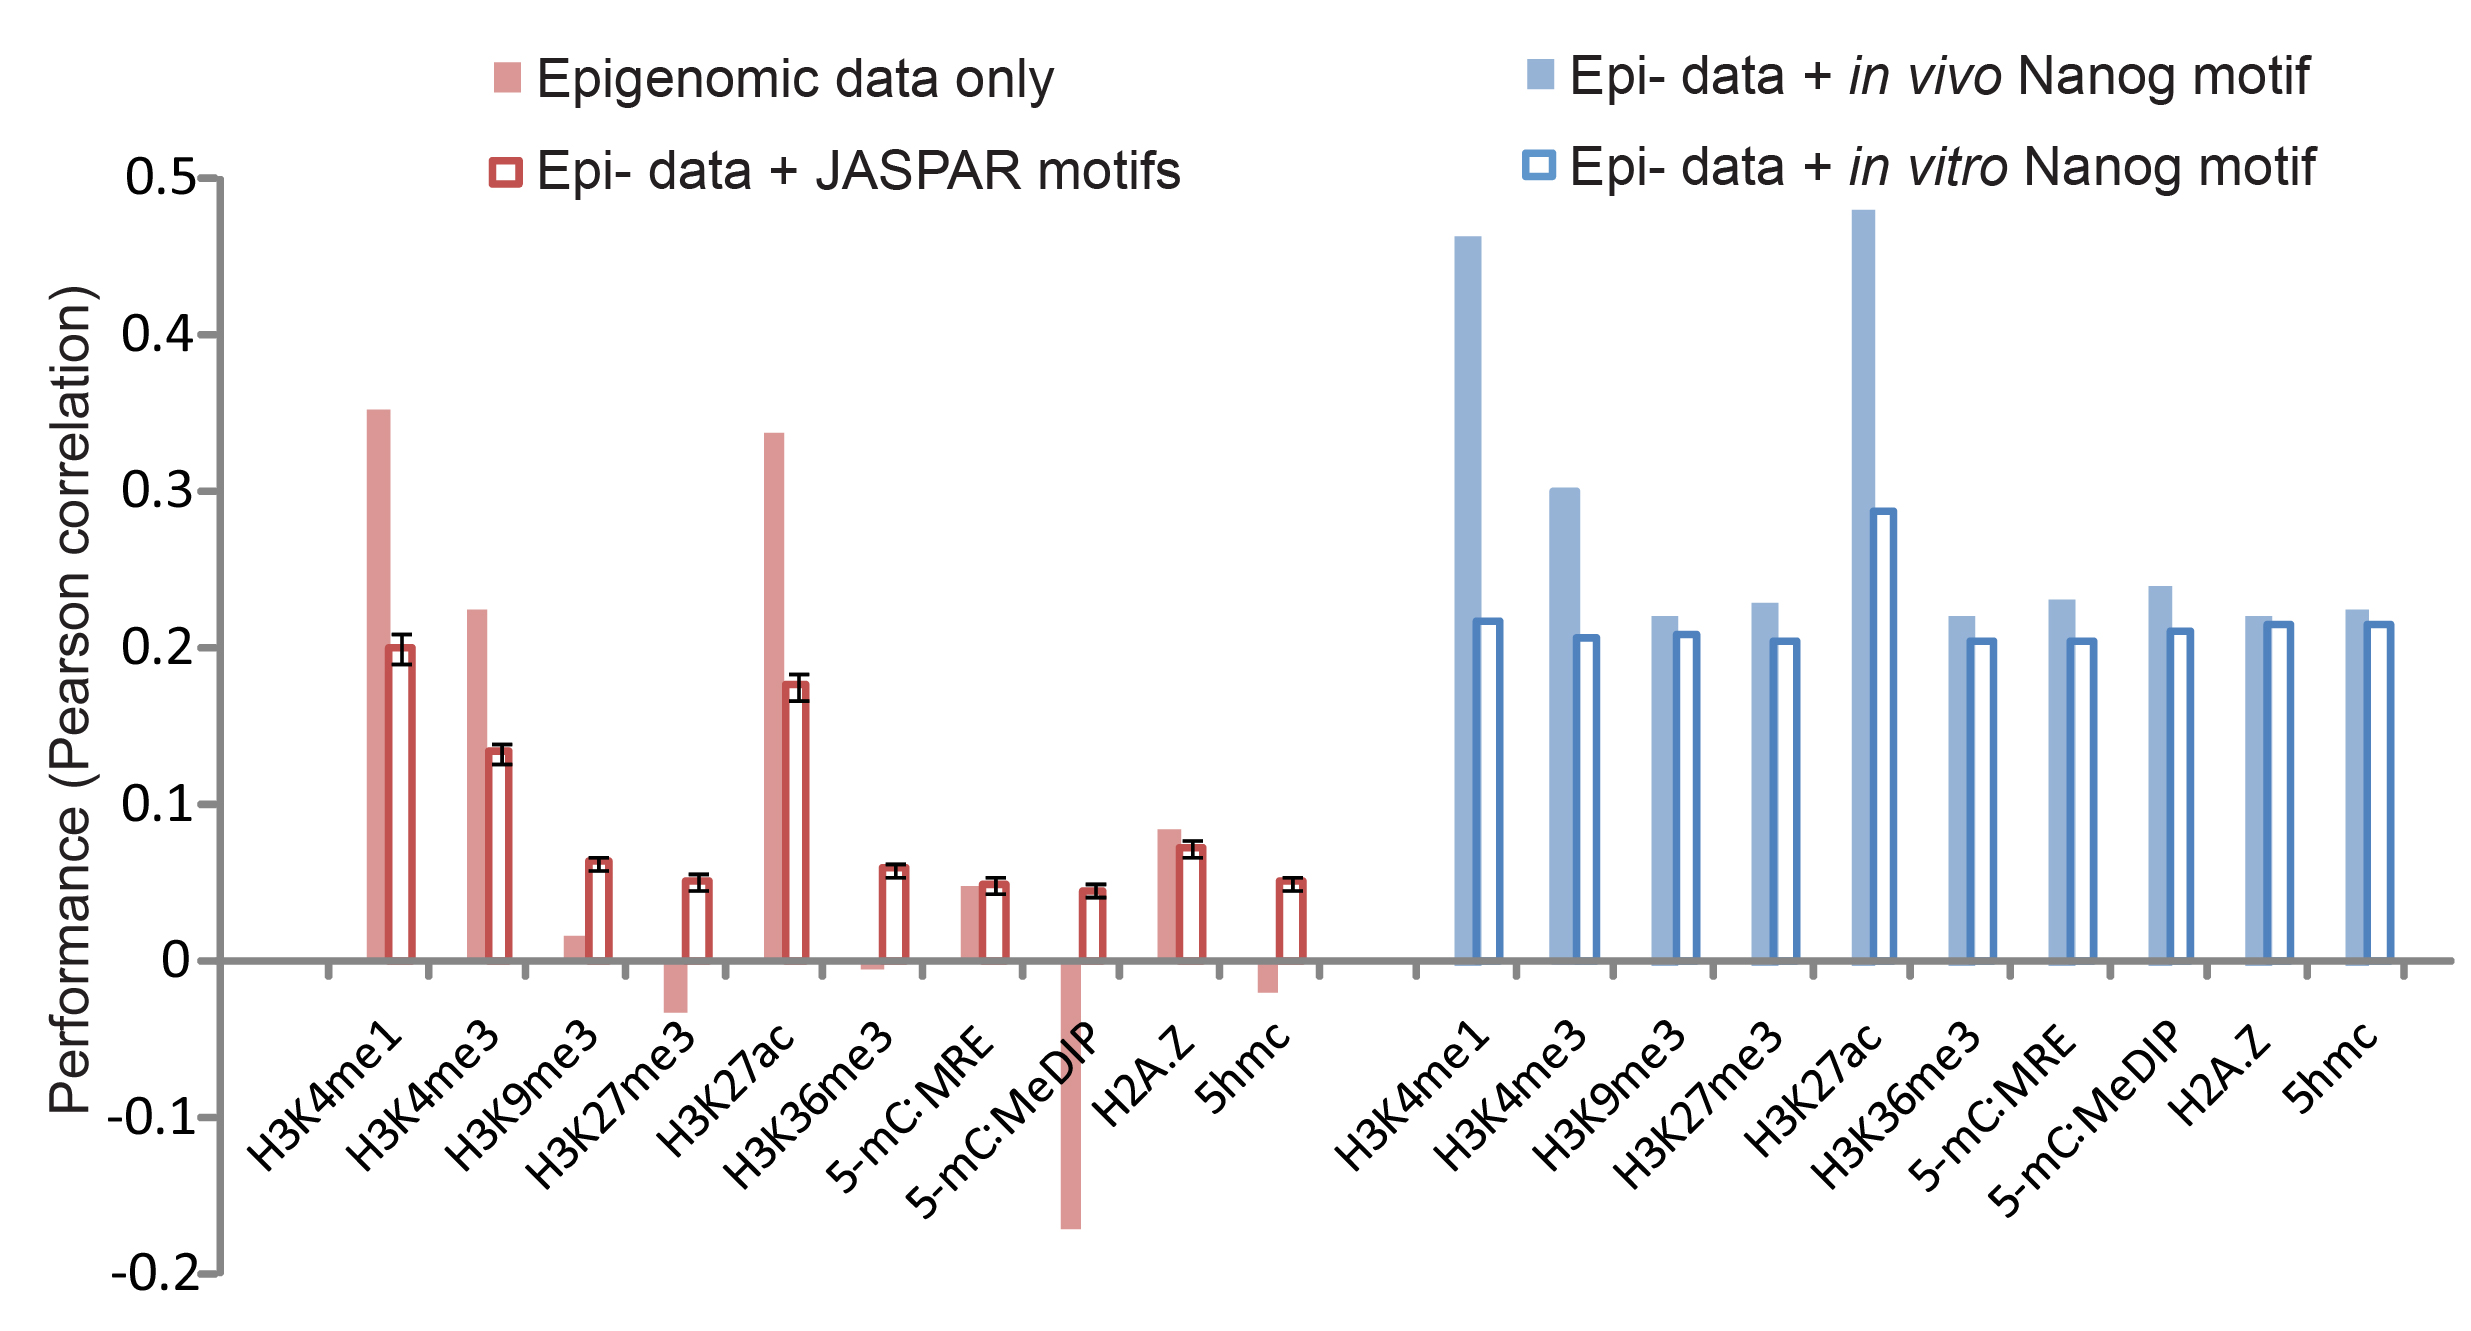
Figure S3. (EPS)
Comparing model predictions with different sequence motifs. Using the Nanog dataset, we compared model predictions in four scenarios. In each scenario, the model predictions were correlated to ChIP-seq measured Nanog binding intensities (y axis). These scenarios are: 1, simple correlation between epigenomic data and binding data without using the model (solid pink bars); 2, using each epigenomic mark with all the (214) PSWMs from the JASPAR database (hollow pink bars: the mean of the 214 correlations, error bar: standard deviation of the mean); 3, using each epigenomic modification with the in vivo Nanog motif (solid blue bars); 4, using each epigenomic modification with the in vitro Nanog motif (hollow blue bars).
doi:10.1371/journal.pcbi.1003367.s003

Figure S4. (EPS)
Differences of the predicted TF binding regions from the in vivo and the in vitro Nanog motifs. The in vivo and in vitro motifs with epigenetic data (Here H3K4me1 as an example) were used to predict TF binding regions (BRs). The prediction based on the model returning a binding probability score within [0, 1], and the TF BRs were called by applying a threshold on this probability score. The numbers of TF BRs were called with a high threshold (A, B) and a low threshold (C, D) in both training data (A, C) and testing data (B, D). The numbers of true positive TF BRs (verified by ChIP-seq) are given outside of the parentheses. The total numbers of predicted TF BRs, including both true positives and true negatives are given inside the parentheses.
doi:10.1371/journal.pcbi.1003367.s004

Figure S5. (EPS)
Comparison of different cutoffs on calling strong and weak binding sites. The difference of model-predicted binding probabilities with and without the epigenome (y axis) is larger in weak-TFBS-only regions (right column) than in the regions containing both strong and weak sites (mixed, middle column), which in turn is larger than in the strong-TFBS-only regions (left column). The thresholds for calling strong sites and weak sites are K(Scon) – 3.5 and K(Scon) – 7.0, respectively, where K(Scon) is the consensus score. These thresholds are different from those used in Figure 5D.
doi:10.1371/journal.pcbi.1003367.s005

Figure S6. (EPS)
Variations of the strengths of NFκB binding regions. (A) The inter-individual variation of the strengths of NFκB binding regions are quantified by Difference Ratio ( DR, y axis), which is defined as DR = |I(Si) - I(Sj)|/min( I(Si), I(Sj)), where I(Si) and I(Sj) are the binding strengths of sequences Si and Sj in individuals i and j measured by ChIP-seq experiments. The mean (each bar) and standard error (error bars) of DRs in DSDB (left) and DSNDB sequence sets (right) are shown. The distribution of GM12878 NFκB binding in DSDB (left) and DSNDB (right) sequence sets, where DSDB and DSNDB were identified from the comparison of GM12878 and GM18505 (B) and from the comparison of GM12878 and GM12892 (C). CEU: Northern and western Europe. YRI: Nigeria. SE: standard error.
doi:10.1371/journal.pcbi.1003367.s006

Figure S7. (EPS)
Interactions of NFκB and epigenomic marks. The Pearson correlation between model-predicted and ChIP-seq measured binding intensities (x axis) is used to identify the epigenomic marks interacting with NFκB. The genomic sequence and ChIP-seq data of GM12878 were used to fit the model. DSDB and DSNDB sequences were identified from comparing sequence and epigenomic data of GM12878 and GM18505. The results from four-fold cross validations are shown. Shaded bars: training data. Hollow bars: testing data. Length of each bar: the average value from four-fold cross validations. A total of 200 randomized epi- datasets were used as controls (Control). Four-fold cross validations were performed on each randomized dataset. The mean correlation from these four-fold cross validations of 200 random datasets is represented by the length of each Control bar. Error bars: standard deviations of the mean. The epigenomic marks that significantly increase the Pearson correlation from the control experiments are identified (*, p-value<0.01).
doi:10.1371/journal.pcbi.1003367.s007

Figure S8. (EPS)
H3K9ac and H3K4me2 are associated with small variation of NFκB binding. Two other comparisons (GM12878 vs. GM19099 and GM12878 vs. GM18951) confirm that the average intensities of H3K9ac and H3K4me2 are higher in DSNDB regions (blue) than in DSDB regions (red). As a control, no reproducible differences between DSNDB and DSDB regions are found for H3K36me3. The centers of all NFκB ChIP-seq peaks are superimposed to ‘Position 0’ on the x axis. DSNDB: different sequence no difference in binding. DSDB: different sequencedifferent binding. SD: standard deviation. CEU: Northern and western Europe. YRI: Nigeria. JPT: Japan.
doi:10.1371/journal.pcbi.1003367.s008

Figure S9. (PDF)
Variations of binding energies of the TFBSs with SNPs. (A)The inter-individual variation of the TFBS binding energies was determined by PSWM scores. For individuals i and j with a SNP in a NFκB binding region Sk, the absolute difference of sequence-determined binding energies is defined as |ei(Sk) – ej(Sk)|, where ei(Sk) and ej(Sk) are the PSWM scores of TFBS sequence Sk in individuals i and j. The mean (each bar) and standard error (error bar) in CEU (left) and CEUYRI (right) are shown. The distribution of variations of binding energies in (B) CEU and (C) CEUYRI comparison.
doi:10.1371/journal.pcbi.1003367.s009

Figure S10. (PDF)
Distribution of PSWM matching scores in DSDB and DSNDB regions. (A) CEU (B) CEUYRI comparison.
doi:10.1371/journal.pcbi.1003367.s010