Tutorial for the two-species clustering software
Our two species clustering algorithm is a mixture model-based approach to deal with two-species joint clustering problem. Its goal is to find the genes that are clustered together in both species.
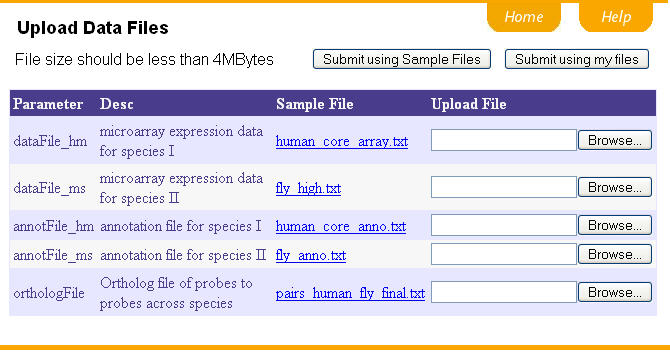
Before preprocessing, let's walk through all the files needed in the data analysis. These file can be uploaded via the program interface. We provide a sample file for each input file. By clicking the hyperlink, you can see what the sample files look like. You may use the sample files by clicking "Submit using Sample Files". Or you can upload the data files that you would like to process and finally click "Submit using my files".
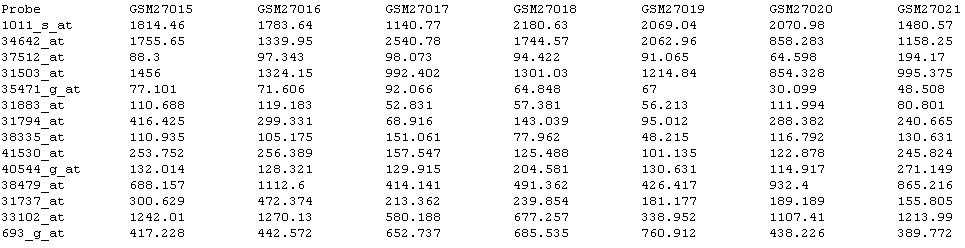
Data file of each species(including dataFile_hm and dataFile_ms):
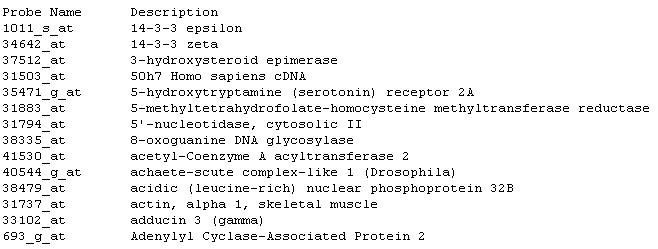
The data file is a table delimitated file, including the description of conditions in the first line and the probe names in the first column. Part of a typical data file is shown like this:
Annotation file for the probes in each species(including annotFile_hm and annotFile_ms):
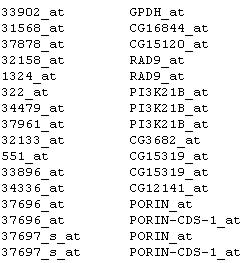
The annotation file is a table delimitated file with 2 columns and many rows. The first column provides the probe names and the second column provides the function descriptions. Part of a typical annotation file looks like this
File of ortholog pairs(including orthologFile):
This is the multiple-to-multiple ortholog map of probe in the first species to those in another species. Each row of the file includes a table-delimitated ortholog pair: the probe in the first species and its ortholog probe in the second species. Part of a typical ortholog file looks like this
Our clustering program supports preprocess of the data. Preprocess-related paramaters in the program interface are shown like this:
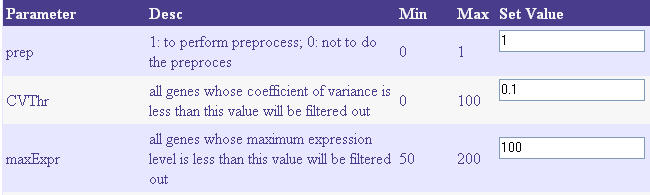
prep = 1: to perform preprocess of data; 0: not to do the preprocess.
If prep = 1,
CVThr: the probe whose variance is less than this value will be filtered out.
maxExpr: the probe whose maximum expression level is less than this value will be filtered out.
The program parameters include k, nMaxAlgRun, stoppingThr and psudo_uniform_counts. A default value is provided for each parameter for your convenience.
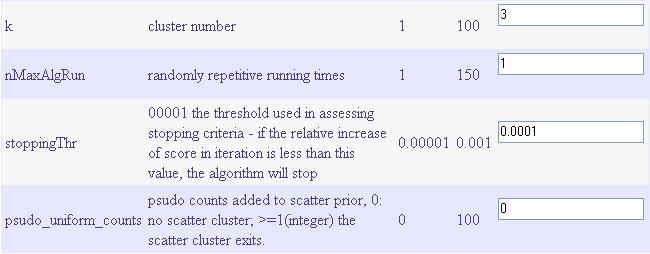
k: setting cluster number.
nMaxAlgRun: setting randomly repetitive running times.
stoppingThr: stopping criteria, if the relative increase of score in iteration is less than this value, the algorithm will stop.
psudo_uniform_counts = 0: no scatter cluster; >=1(integer) the scatter cluster exits and this value of psudo counts is added to the prior of scatter cluster.
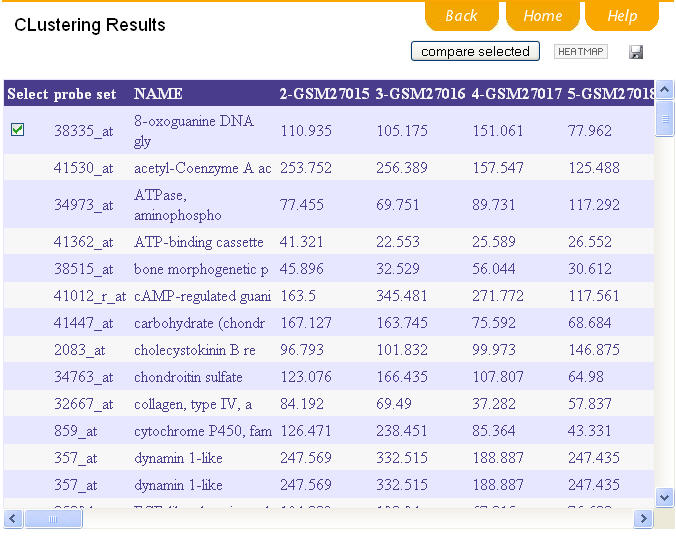
3.Output of clustering results
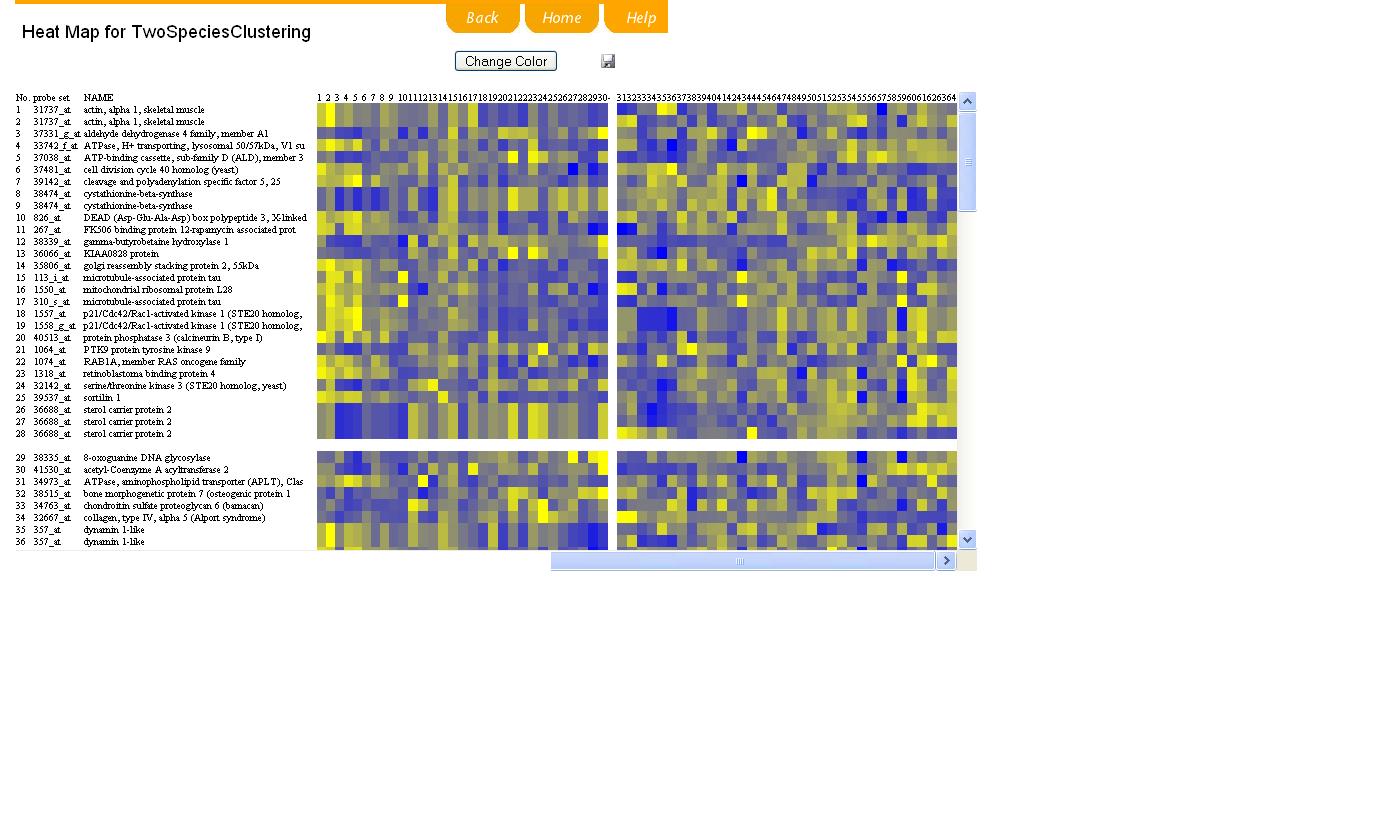
The computation may take some time, which depends on the algorithm you choose and also on the amount of data. So please wait patiently. The final clustering result is shown as demo. You may select one or more clusters by selecting the box of each cluster and clicking "compare selection" bar. You may also click "HEATMAP" bar to show the clustering result in the mode of plot.