
|

|
|
Introduction
Gene Ontology (GO) structures biological knowledge by using a controlled
vocabulary consisting of GO terms. GO terms are organized in three general
categories, “biological process, “molecular function,” and “cellular component,”
and the terms within each category are linked in defined parent-child
relationships that reflect current biological knowledge.
GoSurfer uses Gene Ontology (GO) information in the analysis of gene sets obtained from genome-wide computations or microarray analysis. It retrieves GO information for user input genes and graphically represents the such structured information. Every GO category is visualized as a tree, and users can interact and manipulate the tree by various means.
GoSurfer allows researchers to make comparisons among different sets of genes. Typically two sets of genes, such as genes from two tissues, are mapped onto Gene Ontology tree. Statistical tests can be performed to determine which GO paths are associated with significantly more genes in a particular gene set. The significant paths can be highlighted. All tree graphs and text information can be exported.
Downloading GoSurfer
Users need to download 3 files. 1:
GS.exe
is GoSurfer's main executable program. 2: GOpath.txt is a required input
file. 3. A gene information file. Several gene information files are available to download at
the "Download" page. Please choose one
according to your gene identifier type or microarray type.
Starting GoSurfer and getting help
Click on GS.exe to start the
program. On main menu, click "Help -> Online help", the user will be connected to
GoSurfer's webpage.
Input
GoSurfer accepts 1
text file, with gene
identifiers at the first column, as input file. Gene Identifiers can be Affymetrix probe set
ID, Locuslink ID or Unigene ID. Affymetrix probe set ID is preferred (Currently
some functions are only available to Affymetrix ID). Please use three "NONE"s in three continuous lines as
seperate of gene list groups.
An example of an input file: 1433844_a_at
1425028_a_at
1435382_at
... ...
1449231_at
NONE
NONE
NONE
1456590_x_at
1423327_at
1437239_x_at
1425458_a_at
... ...
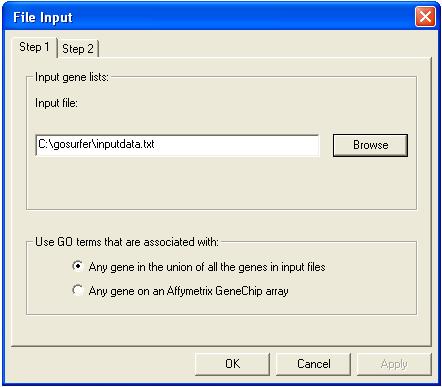
From menu, choose File => File input. A file input dialog shows up. Click on "Browse" button, and choose the input file(s). At the bottom of this dialog, please choose what GO terms should be used. User can either use all the GO terms that are associated with any genes either of the gene lists, or use all the GO terms that are associated with any genes on an Affymetrix GeneChip array. The first option will generally lead to more efficient analysis, and therefore is recommended. Please refer to views for more information.
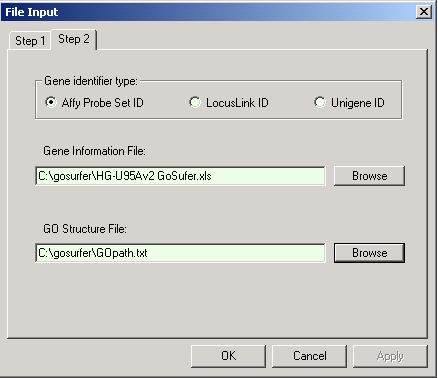
Click "Step 2" on top of the dialog. Please specify the gene identifier type used in the input gene list. Input the file name of the Gene Information File. A Gene Information File is a mapping file that associates different gene identifiers with GO annotations. Please note that the user should specify the Gene Information File that contains the gene identifiers used in the input gene lists specified in step 1. Please find and download the appropriate Gene Information File in the "Download" page. For details about how Unigene/Locuslink/Affymetrix ID was mapped to GO terms, please see "FAQ".
Also please indicate the path of the GO Structure File (GOpath.txt). Please go to the "Download" page to download it.
Click "OK" button. And
Input starts. The following message will show on screen:
reading gene information ...
reading gene ontology ... ...
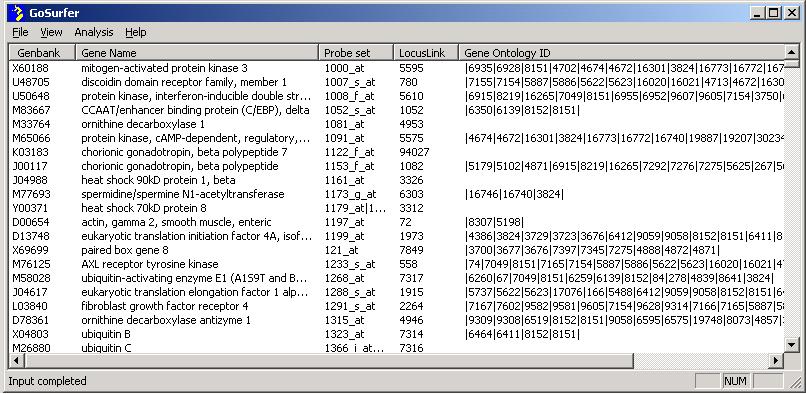
When input completes, gene information will show on screen, and a message "Input complete" will show on the lower left corner of the screen.
For questions concerning different probe sets linking to the same gene, and replicated identifiers in the input file(s), please see FAQ.
Views
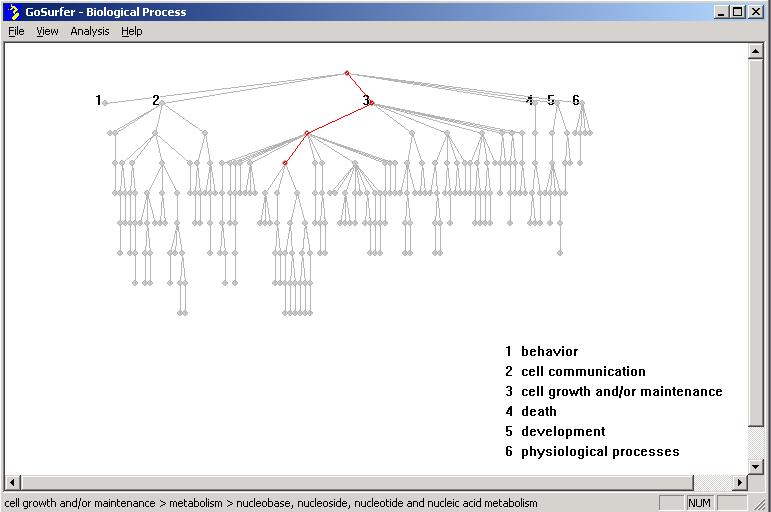
Click "View => Biological Process" to view the tree structure
of "Biological Process" related GO terms. If on
step 1 of the input dialog, the user chose the first
option, "Any gene in the union of all genes in input files", the tree of
"biological process" will be drawn using only the GO terms that are associated
with the genes in the input files. If the user chose the second option, "Any
gene on an Affymetrix GeneChip array", a huge GO tree
representing all GO terms that are associated with any genes in the
Gene Information File, specified in
step 2, will be drawn. Please
notice that drawing such a figure can be very time consuming (~1 minute on a
current main stream PC). After such a tree is drawn, the
user can use "Analysis => Highlight => Simple" to highlight the
GO terms that are associated with the genes in the input gene lists.
Click "View => Molecular Function" and "View =>Cellular Component" to show the corresponding GO trees.
Every node in a GO tree represents a GO term. The hierarchical structure of all GO terms is represented by the tree structure. The root of a tree must be one of the three GO terms: Biological Process, Molecular Function, and Cellular Component, because they are the up-most ancestor terms. The sequence from the root to a node in the tree is called a GO path.
Mouse and Arrow keys
When the mouse is pointing at a node, the name of the according GO
path will show on the bottom of the screen. Double click on a node, the
genes that are associated with this node will show up. Pressing array keys
can expand or constrict the tree.
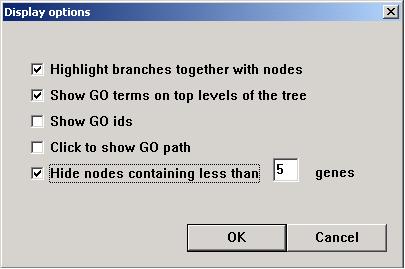
Choose the way the user would like the image to
display.
"Highlight branches together with nodes" will have effect when the user uses
"Analysis => Highlight" function. When selected, both the node and
the branch connecting it to its parent term will be highlighted together. "Enable quick display" will speed up display,
but the GO path will not show when the mouse is point at a node. However, the
user can click on a node to show its GO path.
"Hide nodes containing less than __ genes" trims
the GO tree by cutting nodes (GO terms) that are associated with a small number
of genes from the input gene list(s).
Viewing gene
list and GO list
"View => gene
list" shows gene information.
"View => GO list" shows Gene Ontology
information.
Highlighting: "Analysis => Highlight"
"Analysis => Highlight" uses one of the two ways to
highlight GO tree.
1. Simple. A node is colored magenta if a least one gene in input gene
list group 1 is associated with it, but none of group 2 genes is associated. A
node is colored blue if vise versa. A node is colored gray if both of the groups have genes
associated with it.
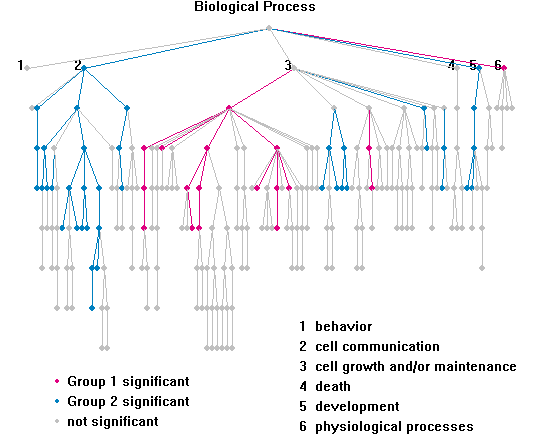
2. Test for significance. Every node is tested for whether either of the
the two input gene lists has
a significantly larger proportion of genes that are associated with it. A Pearson's Chi-square test is
performed. A node is colored magenta if group 1 has a significantly larger
proportion of genes associated with it, comparing to group 2. A node is colored
blue if vice versa, gray if not significant. When there is only one group of input genes, the test
for significance function can still be performed. In this case, the group of of
input genes are compared with all the genes contained in the
Gene Information File. It is as if using
all the genes in the Gene Information File as the second input gene list. Notice
that this function usually takes several minutes to perform.
3. Significance test, adjusting for
multiple testing issue. A new statistic,
q-value is used to find GO terms with better statistical confidence.
This is an example after highlighting:
Changing colors and branch width
The colors, the branch width, and the node radius can be changed by
clicking "View => Color and Width"
Output
1. Image output. Users can save the currently on screen image by
clicking "File => Export => Current Image" menu.
2. Gene ontology information output. Click "File => Export => GO
list", and all GO information, including GO ID, GO term, the genes of each
group that are associated with this GO term, and the p-value of every GO term,
will be exported to one tab delimited file. It there is a lot of GO
information to output, this function can take several minutes to finish. The
output progress is shown at the lower left corner of the screen.
Acknowledgement
GoSurfer is a product of Wong
Lab. We are very grateful to our
collaborators who kindly provided us with data, suggestions and help:
Cheng Li, Florian
Storch, Ovidiu Lipan, Ming-Chih Kao, Charles Weitz.
This site was last updated 12/11/06