An Evolution Model
of Transcription Networks
Reference
Towards an evolutionary model
of transcription networks. Dan Xie*,
Chieh-Chun Chen*, Xin He, Xiaoyi Cao, Sheng Zhong. PLoS Computational
Biology, 7(6): e1002064, 2011.
Downloads
Source Code, Simulation
Data, Yeast Data, Mammalian
Data
Running the program
Usage: ./EvoRgNet ĪVmf miscfile ĪVbs seqfile0 ĪVfs
seqfile1 ĪVe cluster [-r realdata]
The program takes five arguments as input files:
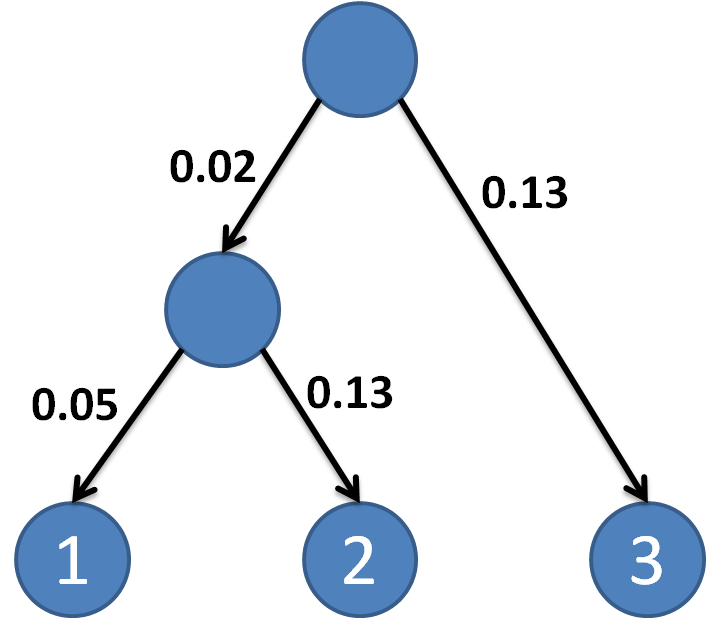
miscfile: The file contains the
information of the phylogenetic tree and the initial probabilities for each
cluster to be unregulated or regulated, denoted as Q and P in the main text.
Here is the format of a sample file.
0.02 0.05 0.13 0.13
0.1 0.225 0.225 0.225 0.225
0.1 0.225 0.225 0.225 0.225
0.1 0.225 0.225 0.225 0.225
0.80 0.05 0.05 0.05 0.05
0.80 0.05 0.05 0.05 0.05
0.80 0.05 0.05 0.05 0.05
The first line is the branch length of the phylogenetic
tree for mammalian data.
The second to fourth lines are the probabilities of
two clusters to be unregulated by the transcription factor (TF) of our
interest. Each line represents a species with the probabilities of five expression
clusters to be unregulated.
The fifth to seventh lines are the probabilities of
two clusters to be regulated by the transcription factor (TF) of our interest.
Each line represents a species with the probabilities of five expression
clusters to be regulated. The order of the species should be the same
thoughtout this file. Note that the numbers of clusters donĪ”t need to be the
same for all species. All above numbers are separated by a tab.
seqfile0: The file represents the
background distribution of the sequence file. Here is the format of a sample
file.
1 1 1
1 1 1
1 1 1
1 1 1
1 1 1
The column represents each species and the row
represents a gene. The numbers are separated by a tab.
seqfile1:
The file represents the
sequence scores generated by a hidden markov model with both the motifs and
background states, mentioned in method section in main text. The format is the
same as seqfile0. Here is the format of a sample file.
0.222879028843425 0.222879028843425 0.222879028843425
5.10540162563391 3.08836285206605 24.9876539355866
0.222879028843425 1.90894545956532 2.127779957246
2.16253350422447 0.222879028843425 4.4694497289581
0.222879028843425 0.222879028843425 0.222879028843425
cluster: The file contains the cluster
index information for each gene. Here is the format of a sample file. The
column represents each species and the row represents a gene. The numbers in
the file show the genes in that particular cluster in the corresponding
species.
1 2 1
2 2 1
0 4 2
2 2 3
0 0 4
Note
that the index of the clusters starts from 0. The order of the clusters in each
species should be the same as it in the miscfile.
realdata: The file contains the tree
state for each gene. Here is the format of a sample file. Each line represents
the tree state to each gene.
1
8
1
1
6
Each state represents different regulatory case,
shown in the following table, where 0 means unregulated and 1 means regulated,
respectively.
|
States |
Species 1 |
Species 2 |
Species 3 |
|
1 |
0 |
0 |
0 |
|
2 |
0 |
0 |
1 |
|
3 |
0 |
1 |
0 |
|
4 |
0 |
1 |
1 |
|
5 |
1 |
0 |
0 |
|
6 |
1 |
0 |
1 |
|
7 |
1 |
1 |
0 |
|
8 |
1 |
1 |
1 |
Note that the realdata file is only required if you
want to infer the regulatory relationship and further do a cross validation to
check the performance.
Output:
If you want to infer the regulatory relationship
without known regulatory data:
(1) The likelihood output containing the likelihood
for eight different outcomes
(2) The regulatory state output containing the
regulatory states for each species
If you want to infer the regulatory relationship
with known regulatory data, you can choose cross validation to test the
prediction of regulatory relationship:
(1) The performance of cross validation.
Examples:
(1) Run without known regulatory data
./EvoRgNet ĪVmf test_misc_file1 ĪVbs SeqScore0 ĪVfs
SeqScore1 ĪVe ExpIndex
(2) Run with known regulatory data
./EvoRgNet ĪVmf test_misc_file1 ĪVbs SeqScore0 ĪVfs
SeqScore1 ĪVe ExpIndex -r realdata
ĪVcv 4
Advanced options
-bt <beta>: The tuning paramters for the weights of
expression data. The default value is 2. We recommend setting the value around
0.1 to 30.
-gm <gamma>: The tuning paramters for the weights
of sequence data. The default value is 1. We recommend setting the value around
0.1 to 30.
-o <output>: The output filename for the regulatory
relationships. The default name is Ī¦output.txtĪ©.
-lo <likelihoodoutput>: The output filename
for the likelihoods in all possible states. The default name is
Ī¦output_likilihood.txtĪ©.
-cv <K>: K-fold cross validation, report the
average performance (correlation)
-co <cvoutput>: The output filename for cross
validation. The default name is Ī¦output_crossvalidation.txtĪ©.
-l <lambda>: the transition rate (from 0:unregulated
to 1:regulated) during evolution. The default value is 0.0053 estimated from yeast
data. The estimate value for mammalian data is 0.17.
-u <mu> : the transition rate (rom 1:regualted
to 0:unregulated) during evolution. The default value is 0.0742 estimated from
yeast data. The estimate value for mammalian data is 0.51.
-px <px1>: the prior probability, the default
value is 0.25.
-al <alpha>: the initial proportion of genes
been regulated by the TF. The default value is 0.5.
Contact Chieh-Chun
Chen (cchen63 AT