Cytoscape[1] is an open source bioinformatics software platform for visualizing molecular interaction networks and biological pathways and integrating these networks with annotations, gene expression profiles and other state data. It can be used to fetch, show, merge or edit complex networks, rendering them "readable to human beings".
| Preparation | Workspace | Edit | Filter | Layout | External Data | vizMapper | Expression Analysis | Plugins | Resources | Reference |
The website for Cytoscape is http://www.cytoscape.org/, where the software itself and the plugins can be retrieved. This demonstration will be done with Cytoscape v 2.6.3. This demonstration is modified from Cytoscape tutorials from the Cytoscape website.
Cytoscape requires Java SE 5 or Java SE 6 to be run.
| Preparation | Workspace | Edit | Filter | Layout | External Data | vizMapper | Expression Analysis | Plugins | Resources | Reference |
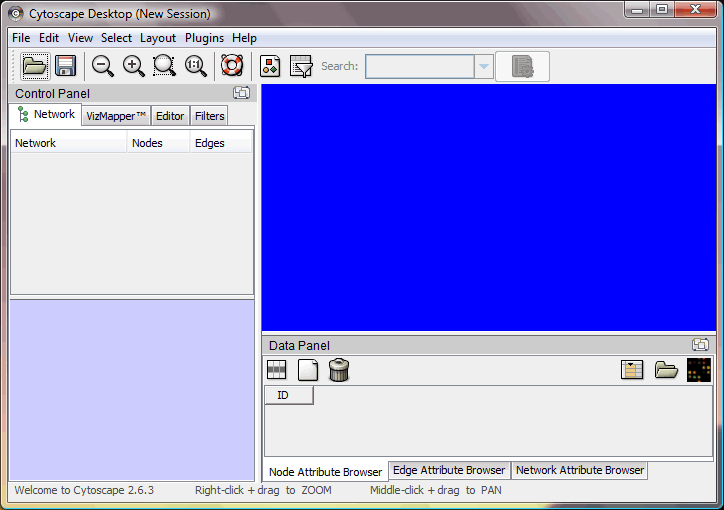
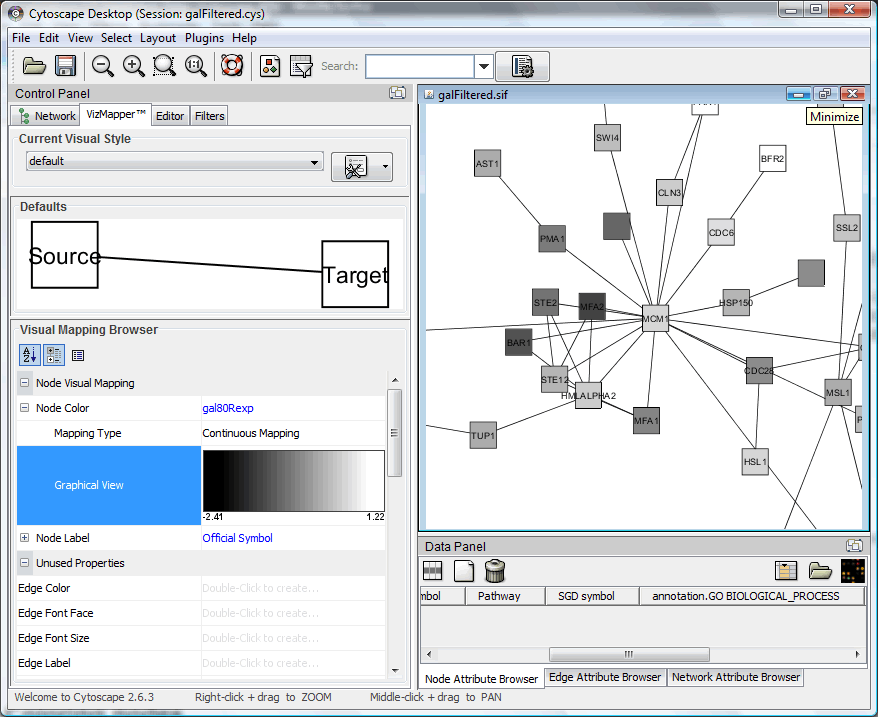
After you launch Cytoscape, the initial workspace should look like below:
The blue area will be the place where your network will appear during the operation, and the rest are different tools / panels provided by the software.

This is the toolbar, including open/save session, zooming tools and other frequently used command.
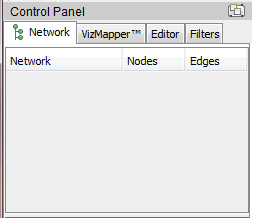
This is the control panel, may be used for editing / filtering / VizMapper.
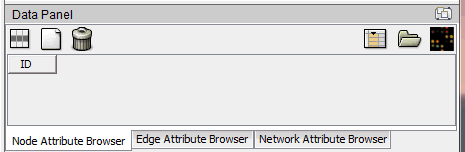
This is the data panel, used to display the data in your network.
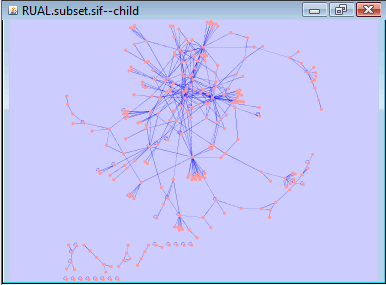
To begin the demonstration, let's import a sample dataset (RUAL.subset.sif and RUAL.na) generated from a human interaction dataset published 2005 Oct 20 in Rual et al., Nature 437(7062):1173-8. First download the two file to somewhere on the local computer. Then use "File -> Import -> Network(Multiple File Types)..." to select RUAL.subset.sif file. After loading the file into Cytoscape, your software should look like this:
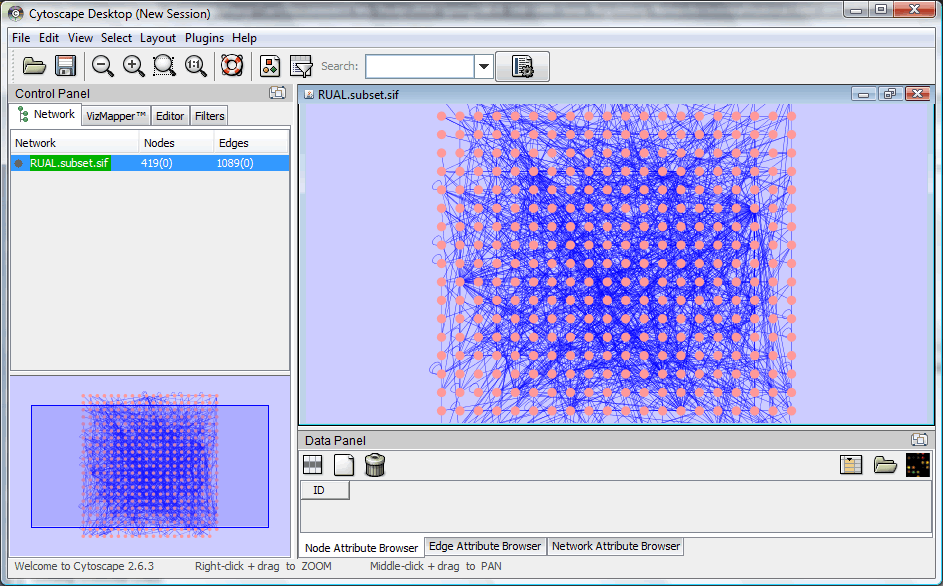
(Node / Edge color may vary depending on the initial settings of Cytoscape)
Use "File -> Import -> Node Attributes..." to open RUAL.na for node attributes. Then click "Select Attributes ![]() " to select "official HUGO symbol" to show the gene annotation. Every round Node represents a protein and edges represents interaction between proteins. Node names can be seen in data panel.
" to select "official HUGO symbol" to show the gene annotation. Every round Node represents a protein and edges represents interaction between proteins. Node names can be seen in data panel.
Sessions can be saved / loaded via the save / load function.
| Preparation | Workspace | Edit | Filter | Layout | External Data | vizMapper | Expression Analysis | Plugins | Resources | Reference |
Networks can be edited in Cytoscape in different situations. Nodes and edges can be selected by clicking or drag-selecting on the network view. Selected nodes / edges will have a different color.
Select the node / edge to be deleted, then use "Edit -> Delete Selected Nodes and Edges" or press [Del]
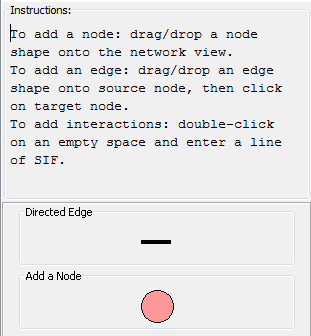
Use "Editor" tab in control panel (see below). Follow the instructions on the tab to add a new node / a new edge.
| Preparation | Workspace | Edit | Filter | Layout | External Data | vizMapper | Expression Analysis | Plugins | Resources | Reference |
Sometimes we only need a specific portion of the network. Here we will demonstrate filtering on the previous loaded network. Use "Filters" tab in control panel (see below).
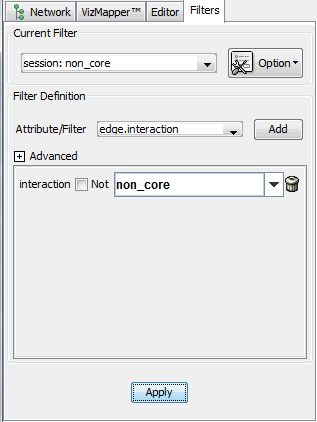
Select "Option -> Create new filter..." to create a new filter session, name the session as you wish. Then select "edge.interaction" in "Attribute/Filter", press "Add". This will filter the network based on the attribute "interaction" of all edges. In "interaction", select the value you would like to select, here we use "non_core" and then click "Apply".
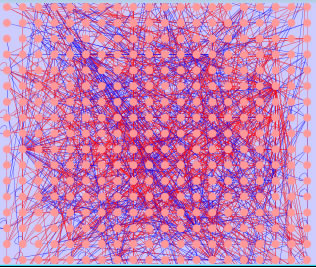
Edges with "non_core interaction" is selected (in red). Delete such edges to remove all non_core interactions.
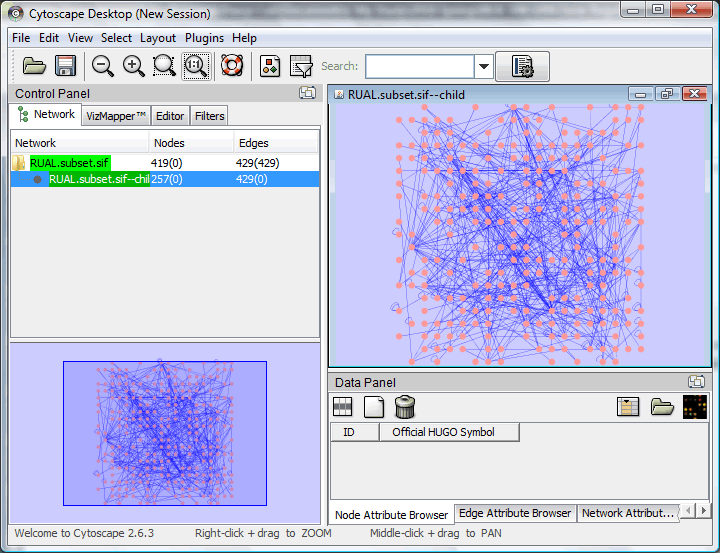
Some nodes will be no longer connected with edges now. We can build a sub-network from nodes that still have edges. Using "Select -> Edges -> Select All Edges" to select all the edges, then use "File -> New -> Network -> From selected nodes, selected edges" to build a sub-network.
| Preparation | Workspace | Edit | Filter | Layout | External Data | vizMapper | Expression Analysis | Plugins | Resources | Reference |
Cytoscape provides different ways to arrange the network. Here we use the previous sub-network to try the layouts. All layouts are in "Layout" menu. Networks may also be scaled in the menu.
Above is "Cytoscape Layouts -> Spring Embedded Layout" of the sub-network we just created (this may not be exactly the same on different machines).
| Preparation | Workspace | Edit | Filter | Layout | External Data | vizMapper | Expression Analysis | Plugins | Resources | Reference |
Cytoscape is able to get various external datasets, to aid the analysis of various interaction.
Pathway Commons is a collection of pathways in various organisms, built and maintained by Memorial Sloan-Kettering Cancer Center and the University of Toronto. Cytoscape can access the pathways in Pathway Commons to build a network around proteins of interest.
Here we can see the interactions between a transcription factor heavily involved in pluripotency, Pou5f1 (Oct4), with other proteins. Use "File -> Import -> Network from web services" and select "Pathway Commons Web Service Client" as data source. Search "Pou5f1" and select "PO5F1_HUMAN" and "Interaction Networks"
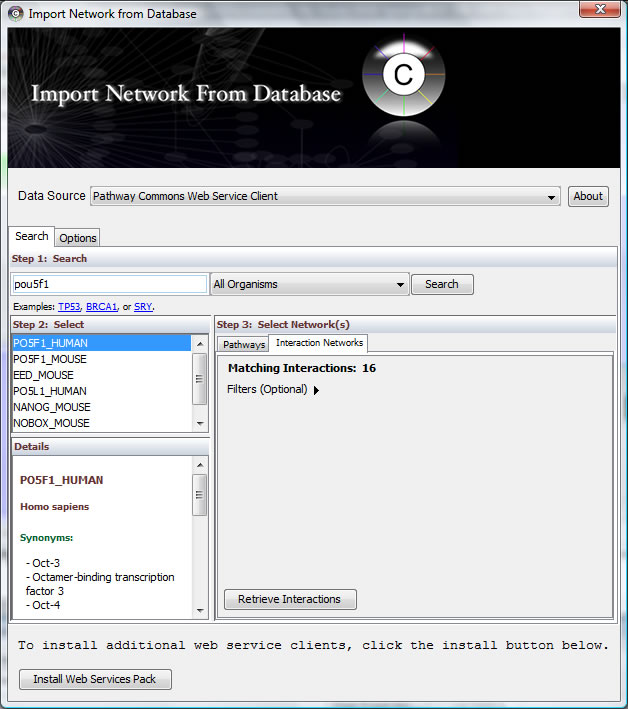
Click "Retrieve Interactions" and choose one interaction network to display.
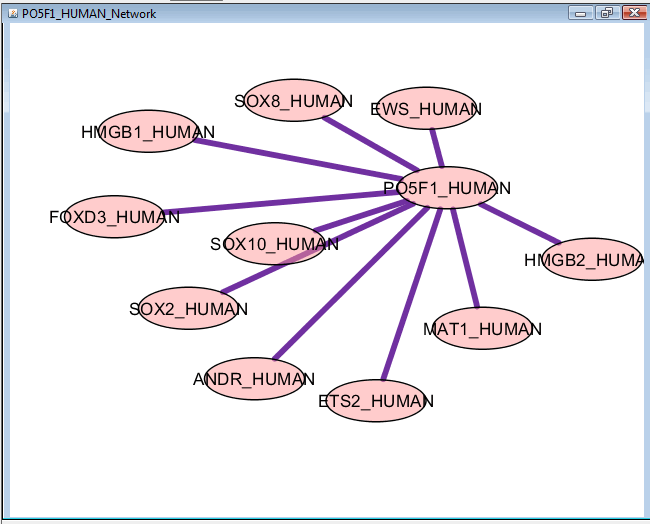
The interaction network of Pou5f1 is generated in Cytoscape. Other pathway / interaction networks can also be loaded for other proteins of interest.
| Preparation | Workspace | Edit | Filter | Layout | External Data | vizMapper | Expression Analysis | Plugins | Resources | Reference |
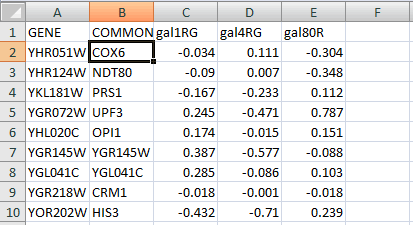
VizMapper is a feature of Cytoscape to show different component in the network. Here we use an external expression file, galExpData.pvals, under <Cytoscape program folder>\sampleData to demonstrate this function. The content of galExpData.pvals is a list of gene expression values of yeast under three different conditions (this can be shown by opening the file in any text editor or Microsoft Excel)
Save current session to file and open the session file "galFiltered.cys" under <Cytoscape program folder>\sampleData to open the sample network. This network contains protein-protein and protein-DNA interactions associated with Galactose metabolism in yeast.
VisMapper can be used to represent expression values with color, size or change the labels of nodes. Here we begin by selecting "default" in visMapper tab in control panel.
Select "Official Symbol" and "Passthrough Mapping" for "Node Label";
double click "Node Color" and select "gal80RExp" and "Continuous Mapping"
Nodes will be colored according to their expression values, in the following case, lighter means higher expression value.
| Preparation | Workspace | Edit | Filter | Layout | External Data | vizMapper | Expression Analysis | Plugins | Resources | Reference |
From the previous result, a preliminary expression analysis can be carried out.
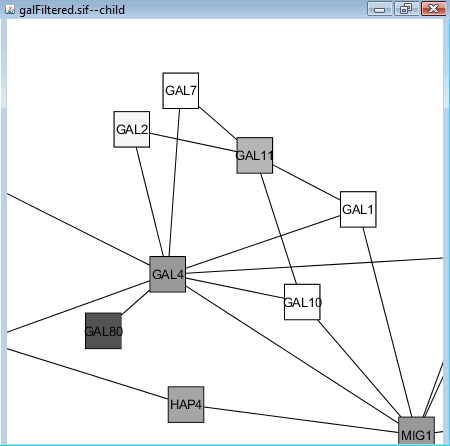
First using filter to filter out "pp" (protein-protein) interactions in the network and build a sub-network of "pd" (protein-DNA) edges. Then select "yFiles -> Organic" Layout.
Zoom in and find GAL4 and GAL80 (both are transcription factors, should be around some highly-expressed nodes, see below). We can see that the expression value of GAL4 does not vary much but GAL80 is strongly repressed. However, because GAL4 is known to be repressed by GAL80, it is likely that slight change of GAL4 expression may up-regulate many other genes, as is shown in the vicinity of GAL4 (GAL1, GAL7, GAL10).
| Preparation | Workspace | Edit | Filter | Layout | External Data | vizMapper | Expression Analysis | Plugins | Resources | Reference |
There are quite a few plugins for Cytoscape to enhance its function or to provide new features, for a detail of plugins please visit the Cytoscape website.
The Merge Networks plugin is included in Cytoscape 2.6, which can be used to merge different networks. You can load previous session of human protein interaction to test this plugin.
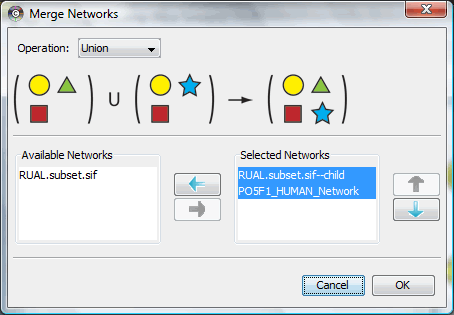
This is the interface for Merge Networks plugin, select the network you would like to merge and the merge operation to get the result.
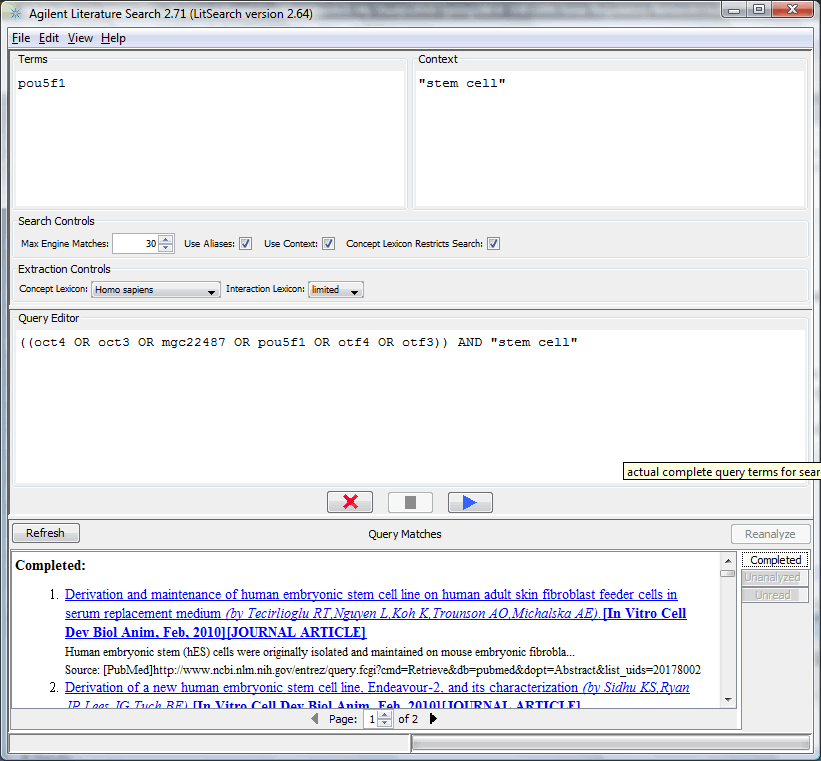
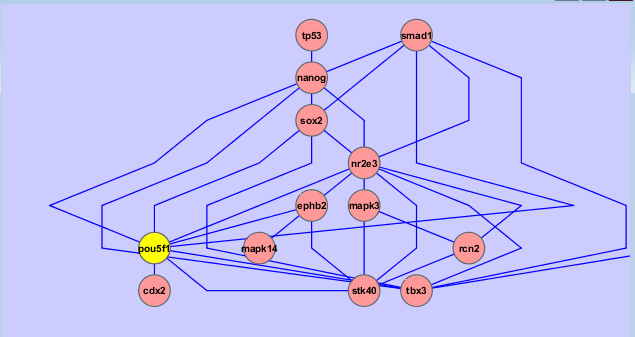
Agilent Literature Search is a plugin which enable user to do text-mining on Pubmed publications to search for potential interactions. Use "Plugins -> Manage Plugins -> Network Inference" to find and install "Agilent Literature Search" (this may take a while). After that, it will appear under plugin menu.
A literature search of Pou5f1 with aliases and "stem cell" context, 30 references can generate an interaction network including most known pluripotent interactions (such as Sox2, Nanog, see below), you may specify other proteins of interest and/or include more references.
| Preparation | Workspace | Edit | Filter | Layout | External Data | vizMapper | Expression Analysis | Plugins | Resources | Reference |
There are detailed web resources to learn to use Cytoscape besides this demonstration. Most of them can be found on Cytoscape website:
Cytoscape tutorial: basic and advanced content for learning;
Cytoscape help-desk: online community where you can ask questions about the software and wait for experts' help;
Cytoscape discussion: community for advanced users about the software, plugin-developing, etc.